There aren’t many chart timeframes that mix comfort and versatility with data sufficiency. Luckily for all of you reading, the 30 minute BTC chart is one that excels at doing this.
Whereas other chart timeframes may offer either solid information with reliable candles - without a quick response time - or the most recent movements - with a strong liability towards fake signals - the 30-minute chart sits right in a nice middle ground between those.
If you’re a day trader, then you will greatly appreciate the information provided by this chart, which gives you 48 opportunities to profit on each day.
On the other hand, longer-termed investors may find extremely useful the ability to acquire more than enough information to better study the status of a trend or to time their enties and exits on this chart.
How To Trade The 30 Minute Chart in the Short-Term
One of the most important reasons to use the 30-minute chart is that it offers enough time for each candle to be a reliable representation of the market at a given moment.
This opens a window of great opportunities to trade using only price action and chart patterns.
For example, let’s look at a trade we made using this timeframe:
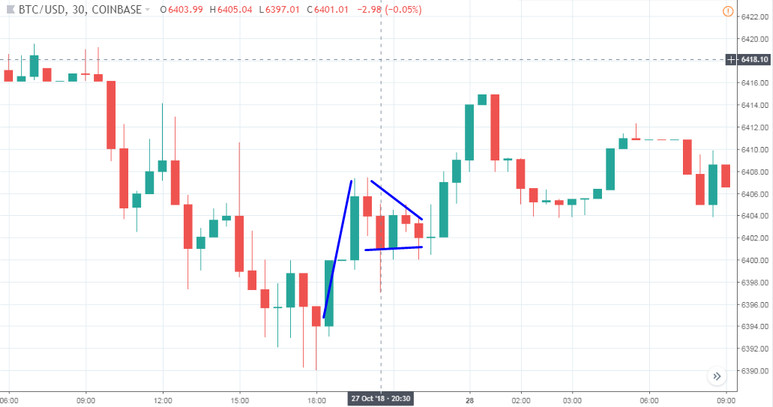
Here, we can see a pennant, a classical chart pattern that signals a trend break before continuation.
As you can see, the chart makes it easier to follow these patterns as they are more consistent in regards to their text-book definition.
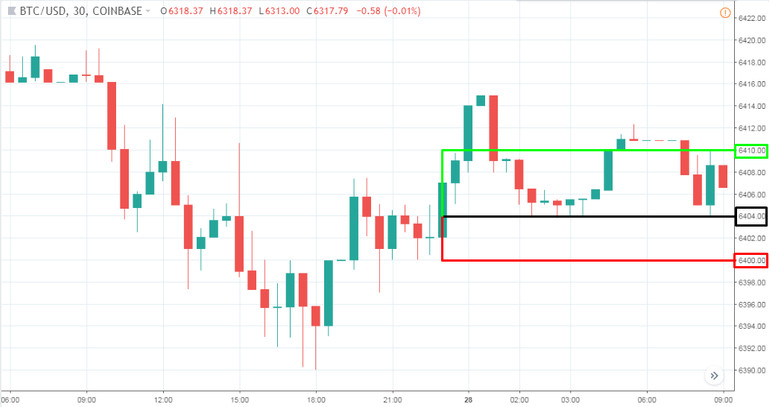
Using this pattern is seamless when you follow the standard procedures for trading it.
Open your position as soon as you see the pattern confirmation. This happened when the last candle started escalating quickly and broke the pattern to the upside.
When it comes to your S/L, you can use the pennant as a reference. Here, we could place the S/L around the lowest point of the latest swing of the pennant.
Lastly, for the T/P, half of the position can be closed at 6410 as it was an important resistance price level. For the second half of the trade, we can use the same distance as the one of the pennant pole.
But here's another very interesting secret technique: here, you don’t need to measure its size, but you can use this measure as a time-based exit. As it was 3 bars in height, this trade was closed 3 bars above the entry level, around 6415 - right at the top of the whole bullish move!
Here’s another case:
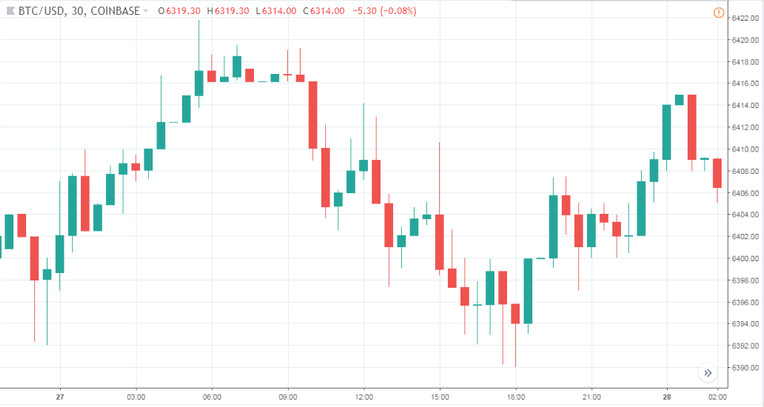
Something interesting happens in this chart, can you point it out?
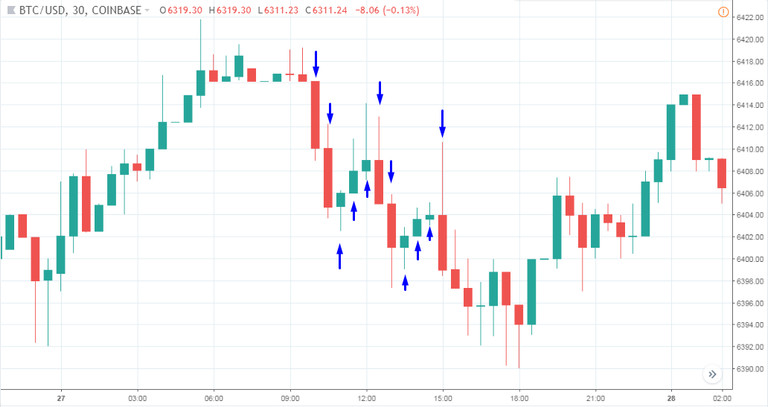
Two large bearish candles are followed by three bullish ones. The pattern immediately repeats itself as two bearish candles form before three bullish ones. Once a bearish candle starts forming yet again, we can immediately execute a trade after its close.
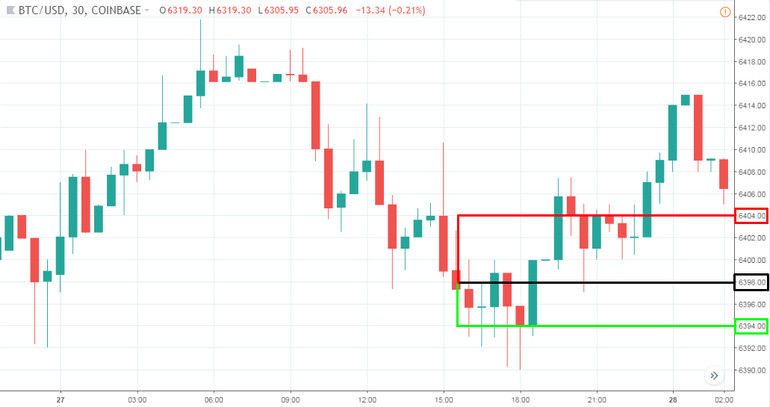
Sure enough, history repeated itself here and we scored a nice $4 profit on a high-probability trade!
How To Use The 30 Minute Chart for Medium-Term Trading
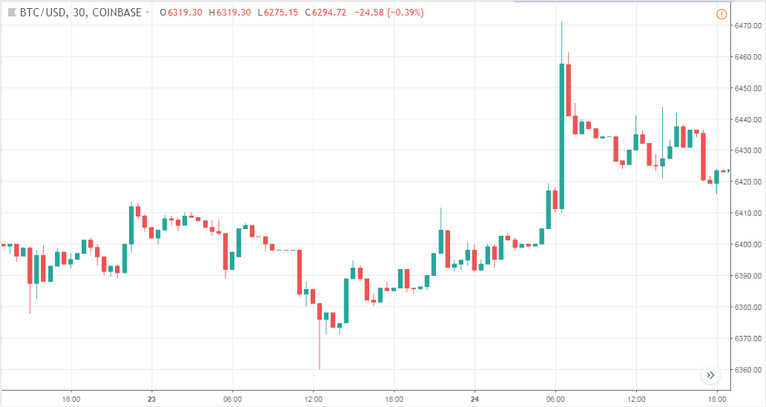
This is a 2-day time period shown on a 30-minute candlestick chart:
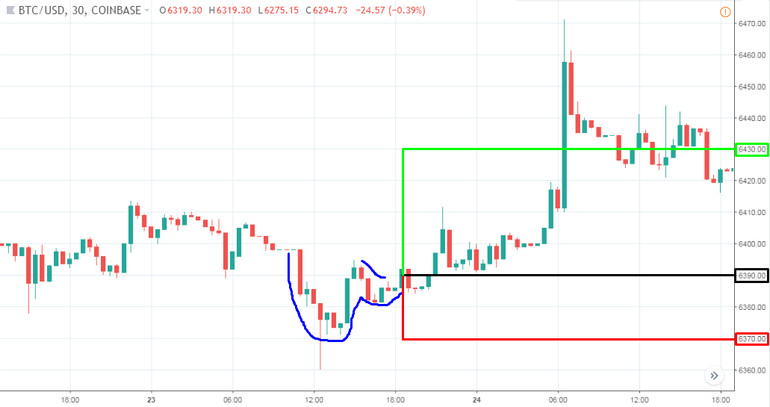
A classic cup-and-a-handle pattern!
Here, you can go long after the pattern was confirmed (after the breakout of the handle to the upside).
Place a S/L at the bottom of the cup.
And place the T/P twice the size of the cup above the entry price.
The S/L was never met, but the T/P was filled in about 12 hours! Another nice and profitable trade based on a chart pattern!


