The name of Fibonacci is quite a universal topic when it comes to the wonders of our world. The seemingly ever-present Fibonacci rations and numbers are a huge phenomenon in how the world - and us as individuals - function.
And guess what, the way the markets are traded is also affected by these magic intervals!
In fact, they’re so influential that there are indicators based on this famous equation, and they work wonders for those who can understand them.
Has this made you curious? I know I was when I first heard about it!
Don’t worry, read on and find out what it is and how to use it.
What Does “Fibonacci” Mean?
When people speak about Fibonacci, they’re actually talking about the famous number sequence of Leonardo de Pisa, which is a numeric sequence created by adding up a number with the previous one:
0, 1, 1, 2, 3, 5, 8, 13, 21, 34, 55, 89, 144, 233, 377, 610, 987, 1,597…
The most noteworthy characteristic about this sequence is that each number (besides the first 4) in the sequence is around 1.618 times greater than the one preceding it; this number is also called the “golden ratio”.
Fibonacci In The Bitcoin & Crypto Market
Traders and financial experts apply the Fibonacci sequence in several ways to try and predict how the market will move, each approach having a different outcome and success rate.
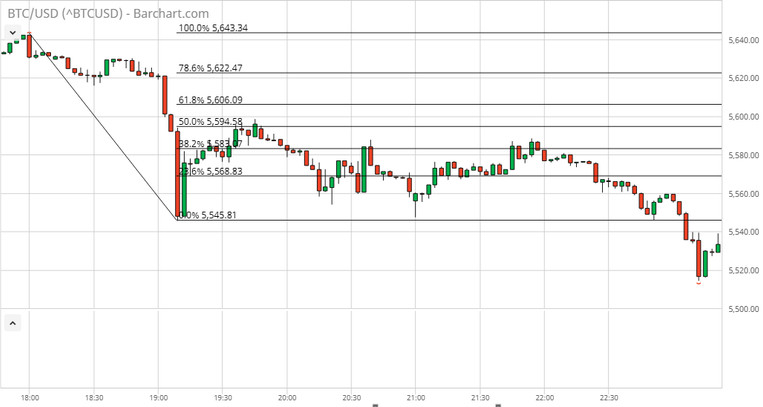
Most BTC traders make use of the most popular indicator based on these ratios, the Fibonacci Retracement:

As you can see, it shows where potential supports and resistances may be based on an already existing price swing. So, let’s now see how are these numbers measured?
You need to pick a high and low price - the most significant latest swing/trend move, and the vertical distance (price variation) between them is divided by these ratios. Always draw the Fibo retracement in the direction of the trend - in case of a bullish trend, draw the retracement from low to high, and vice versa in case of bearish swing draw the retracement from high to low.
Trading BTC With Fibonacci Retracements
So, how do you apply this tool in your trading and how to take trades based on its?
Well, these points are clues when it comes to opening a position or placing your T/P or S/L orders.

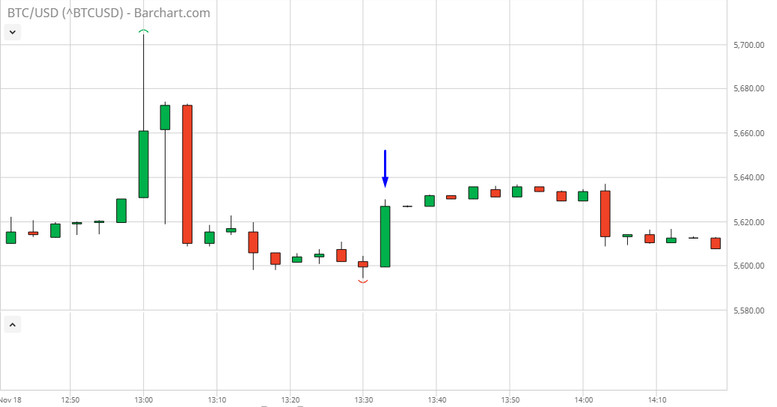
Let’s say we see this huge candle forming (highlighted by the blue arrow) and we went long during that green candle, but we have no clues where we should place T/P or S/L.
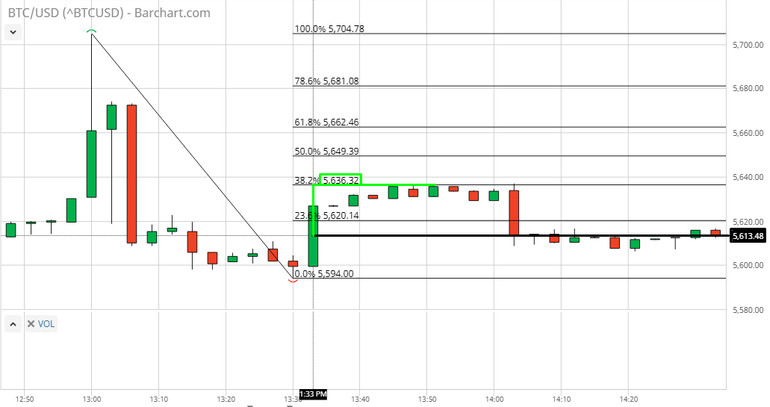
We can draw a Fibonacci Retracement based on the latest price swing:

In this example, we could place the T/P at the next Fibonacci level (38.2%), which is met 6 candles later and nets a 23.44 profit!
And the S/L, in this case, was below the low of the green bullish candle or it could also be below the swing low (the 0.0% Fibo level in the chart).


