Trading breakouts is a very popular strategy among traders in many markets, not just with cryptocurrencies. However, when it comes to cryptos, trading breakouts can be somewhat intimidating after the first impression.
But, you don’t need to worry about that! In this article, I’ll share my secrets with you regarding how to spot breakouts and how to take advantage of them.
What’s A Breakout?
Breakouts occur when the price action surpasses a resistance or support levels (or any chart pattern).
As per their very nature, breakouts break trends, and if they counter the previous trend, then they often signify the start of a brand new trend.
Nevertheless, breakouts don’t always mean counter-trending. An upwards trend may still have resistance levels, or downwards trends can also have support levels, but breakouts can still bring movements that surpass this, usually resulting in new high/low price levels and continuation of the current trend.
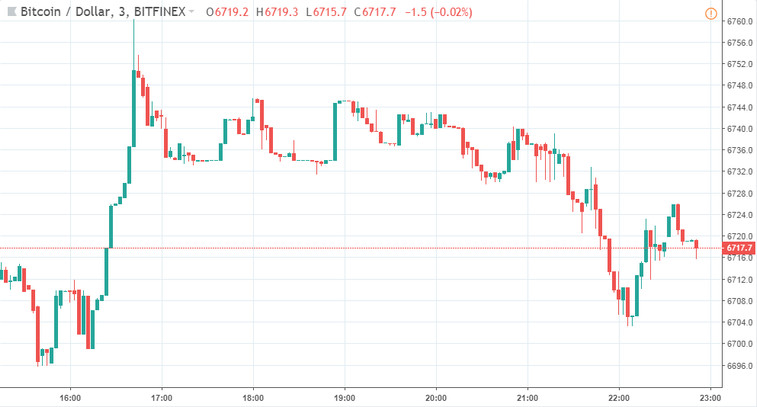
Let’s analyze a 3m Bitcoin chart where we can easily spot a breakout:
Here, you can easily see that support formed around 6,734, and it was broken violently by the red bearish candle that I highlighted by the blue arrow:
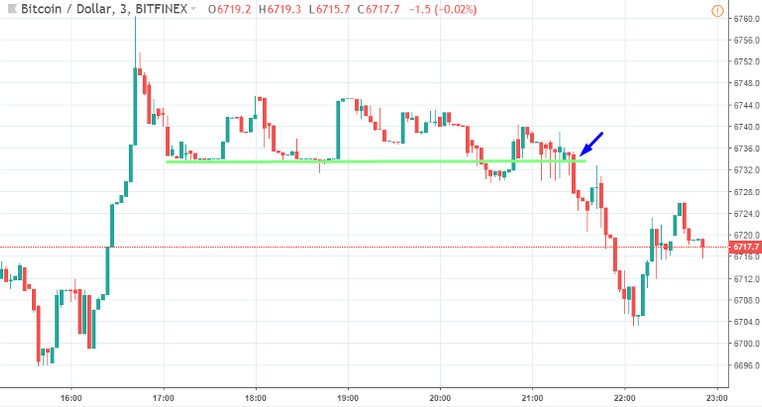
True to our statement, the breakout was also the start of a significant downtrend.
Breakout VS Fakeout
A major part of the definition of a breakout is that it starts a new trend outside the resistance or support levels. If it doesn't turn out that way, then we are inside of a fakeout.
The name is self-explanatory when taken into context; fakeouts are apparent breakouts that don't push the price action into new limits. Instead, they usually go back to the old channel after some swings.
In the same Bitcoin chart, a fakeout is visible right before the eventual breakout that I highlighted by the red arrow:
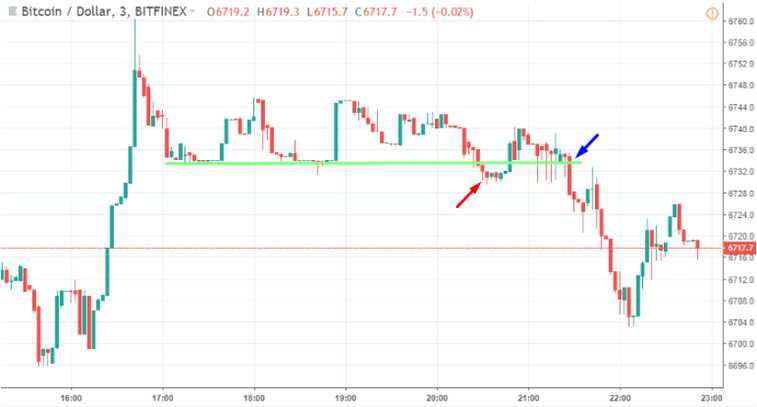
As you can see, the market broke the support and stayed below the support for 6 candles and then reversed back above the support - this is a clear example of a Fakeout. While it´s hard to spot Fakeouts before they happen, even if we have opened the trade based on this breakout and we would place the Stop-Loss correctly, we would stay in the opened trade and it would end in a great profit.
How To Trade A Breakout
Breakouts are an amazing opportunity for traders who wish to ride a trend in the long-term, and I'm going to show you how you can do that.
The best way to trade breakouts is by defining the support and resistance levels in the usual way of chart formation or in a form of a trend channel. Once you do that, you need to pay attention to when the price breaks the specified limits, but don't act right away!
You need the price action to confirm the breakout to avoid the fakeouts and not lose money.
Let's look at this example on the 4h Ether chart:
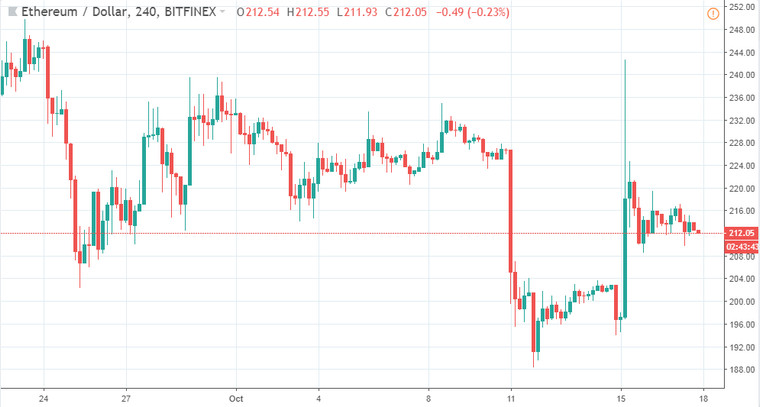
You can notice an uptrend channel forming nice support and resistance levels:
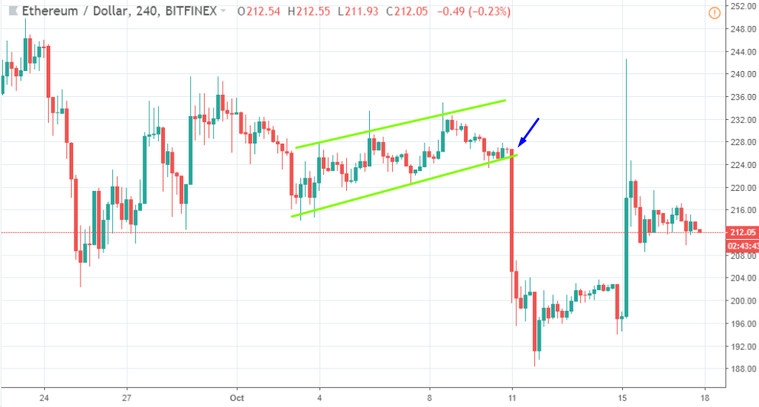
At that moment, I went short. Why? Wasn't I supposed to wait for confirmation?
Well, if you notice the uptrend channel, you can easily spot that it was losing a lot of momentum. The average upward movements were becoming smaller and less frequent on average as it neared, and a slight downtrend started.
Noting this, I quickly placed a SELL position, with a stop-loss above the rising channel. There, I went from around 225 all the way down to almost 200, cashing in a hefty profit for myself.
This was the aggressive option of trading breakouts and I would recommend gaining enough knowledge and experience before trading breakouts aggressively. The conservative way would be to wait for the first candle to break and close outside the rising channel.
The same techniques can be applied when trading standard horizontal support and resistance price zones breakouts.
A Note On Stop-Loss With Breakouts
Breakout trading is one of the most comfortable strategies when it comes to placing stop-losses, as it gives you an excellent clue regarding where to place them: the previous limits and swings.
It's always wise to place your stop-loss some pips away from the level it just broke (or preferably above or below the swing that formed the breakout). Let's say, it broke resistance at 230, then you can place your stop-loss at 225 or 220, or if it broke support at 310, you can place a stop-loss at 320.
Projecting Take-Profits
Regarding Take-Profits, the first of my favorite techniques and probably the simplest one is to place Take-Profits based on following support and resistance zones. This works very effectively with almost any trading strategy.
My second favorite technique is to project Take-Profit based on the swing that formed the chart pattern or support/resistance price zone breakout. Take a look at the chart below:
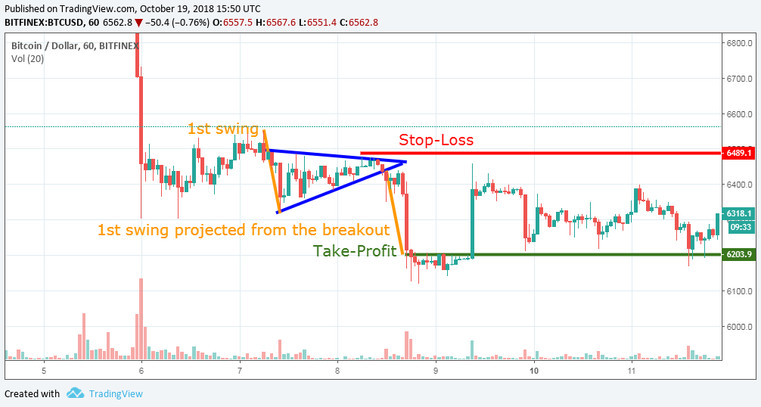
In that chart, I highlighted the 1st swing that started forming the triangle chart pattern. And then when the breakout of the triangle pattern happened, I projected the same length of that swing from the price level of the breakout. Take a look for yourself how accurately the trade was closed in a big profit!
And this little secret technique can be used when trading any type of breakout as well!
This is how I personally trade breakouts, more articles and my personal strategies are coming soon, stay tuned!
Take care and trade well!

