The 4-hour chart is a great ally when you constantly need to be on the move and are not able to dedicate full-time to trading.
Trading off the 4-hour chart and higher allows you to check your charts a lot less often while still giving you enough information for you to proceed with making a trade when spot trading opportunities.
The 4-hour chart crypto trading strategy is excellent for trading price swings that usually last for at least a few days. It gives you all the information you need to do so by filtering out the unnecessary noise from lower time frames, but still, it’s not so long-term to completely lose perspective of what is currently happening in the market.
How To Trade The 4 Hour BTC Chart
As we already mentioned, this timeframe is best for medium-term trading - lasting for several days and sometimes several weeks. It provides data on how a trend behaves not only on a longer-term horizon but also within each day.

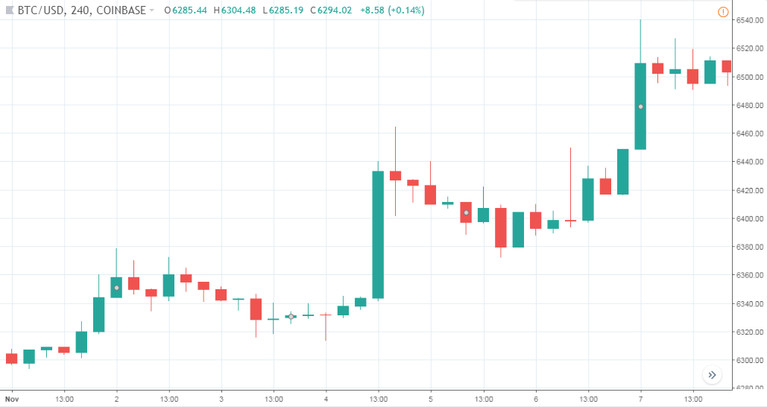
As you can see here, the grid neatly divides this chart into trading days, but the intraday candles are still giving us a lot of information about what is happening in the shorter-term.
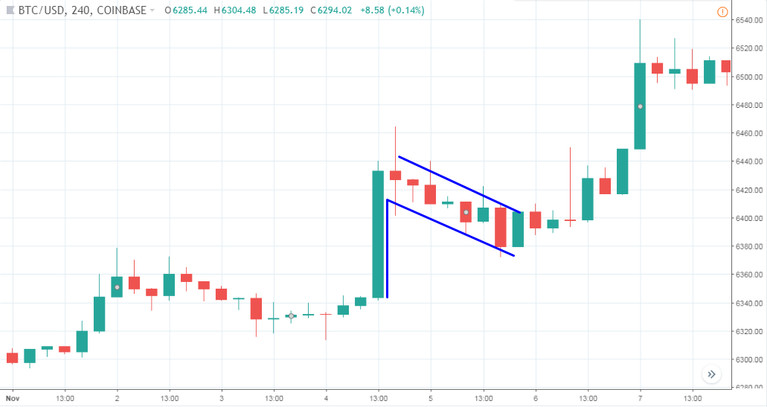
In fact, we can spot a great chart pattern here that we can trade. Can you?

The pattern is a bull flag continuation pattern. While patterns can take much longer to form on the 4-hour chart compared to the 15-minute timeframe or lower, they are much more reliable since the window of consolidation is a lot wider and false signals are less frequent.
Additionally, the gains can be much higher on the 4-hour timeframe while still capturing a lot of the shorter-term trading opportunities.
So, how could you trade it?

When trading patterns, the great thing is that they give you all the information you need regarding where to place your exit points (see entry, stop-loss and take-profit orders). Sell or buy stop orders is my favorite way to use these patterns or it is also possible to wait for the breakout (confirmation of the pattern) and then open a trade manually.
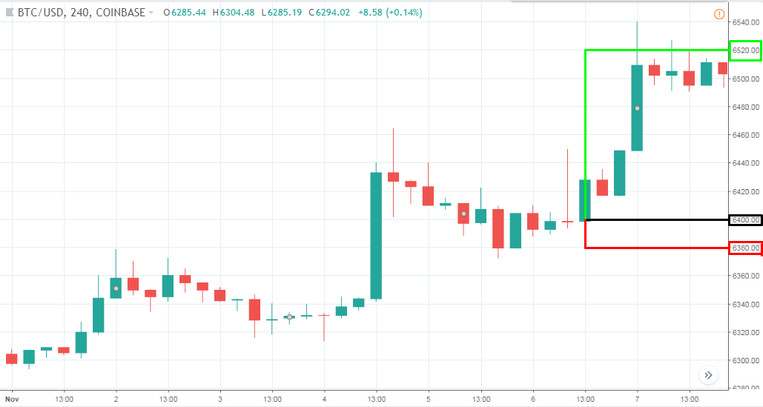
Here, we could have opened a trade right above the resistance line of the pattern when the flag was confirmed. The S/L can be placed at the lowest price of the flag and the T/P at a distance equal to the flag pole.
As you can see, the pattern worked well; the S/L is never reached, and the T/P is met half a day later.
That would have been a profitable trade of 120.00 USD!
Trading Inside Bars on the 4 Hour BTC Chart
Another great feature of the 4-hour chart is that Inside Bars, as well as other candlestick and Price Action patterns, are really helpful, prevalent and reliable.

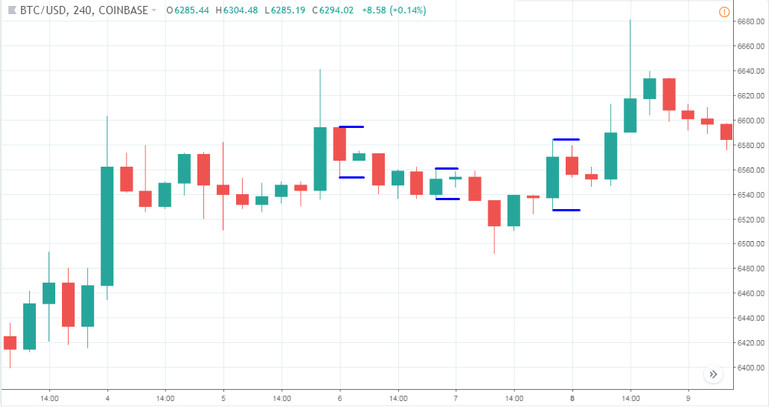
Three inside bars on a single bearish-to-bullish reversal on a consolidating trend. Some people may opt to not trade on these types of events, here we’ll show you a secret.

Notice how the bearish bars are larger when swinging downward and the bullish ones are larger when swinging upward. This is a sign that when you enter the market, the counter-move can occur soon, therefore it's better to aim for small, but frequent profits. Based on the rules of trading Inside Bars, there would be 1 loss and 3 profitable trades - totaling a nice profit.
Simply place buy stop and sell stop orders on the high and the low of the Inside Bar. The stop-loss is on the other side of the Inside Bar (or if the Inside bar is too small, the S/L can be placed based on the previous mother bar). And the profit target is the first nearest support/resistance level or we can also exit based on a trailing Stop-Loss, which is a very effective and popular technique as well.


