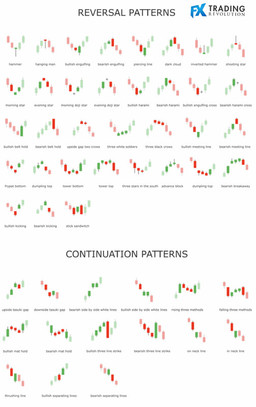
Candlestick patterns, also known as Japanese candlesticks, are a graphic representation of the price movements that encompass the market for a specific trading instrument.
They are one of the most popular tools of technical analysis, which allows traders to interpret price information quickly through candle bars.
Currently, candle patterns are one of the most used analysis tools by investors and traders, thus facilitating their work and visualizing any change in the market. The use of this tool is compelling every day evolves and is more versatile in life.
5 Candlestick Patterns You Should Learn Today
While we all know the basic Pin Bars or Inside Bars , there are many more possibilities when it comes to studying price action with candlestick patterns.
Some of the other candlestick patterns are:
1. Hammer
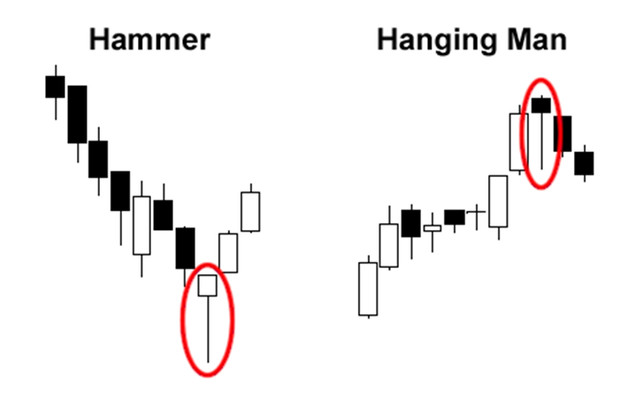
The hammer pattern is made up of a small body with a short or no wick above the body and a long wick on the other side, below the body.
This is the bullish version of the pattern and it shows that there were strong selling pressures during the day, but a strong buying pressure caused the price to rise again. Body color is not important since for the hammer pattern the opening and the closing price of the candle are near each other.
But wait, are you telling now that this pattern looks like a Pin Bar?
Yes, you are 100% correct! Hammer is another name for the Pin Bar.
The bearish version is shown on the chart below. It looks exactly the same as the bullish version but is only inverted.

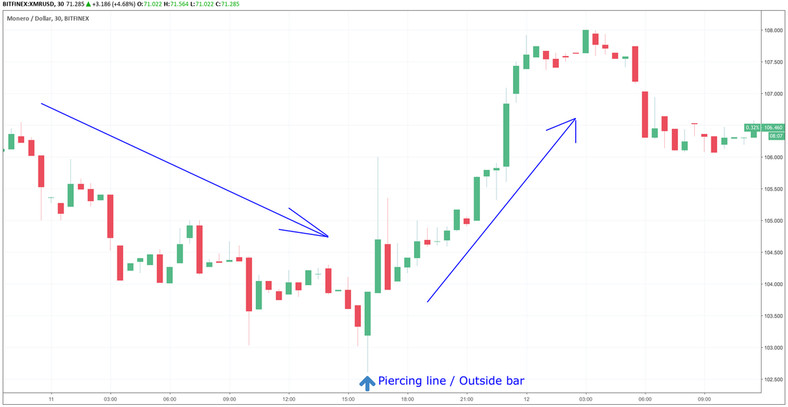
2. Piercing line
This is a two-masted pattern, formed by a long red candle, followed by a long green candle that needs to close at least 50% into the previous red candle.
In general, there is a gap between the closing price of the first candle and the opening of the green candle. This pattern shows when there is a strong buying pressure coming into the market after the price has fallen.
This pattern can be used vice versa as a bearish pattern as well.
3. Morning Star
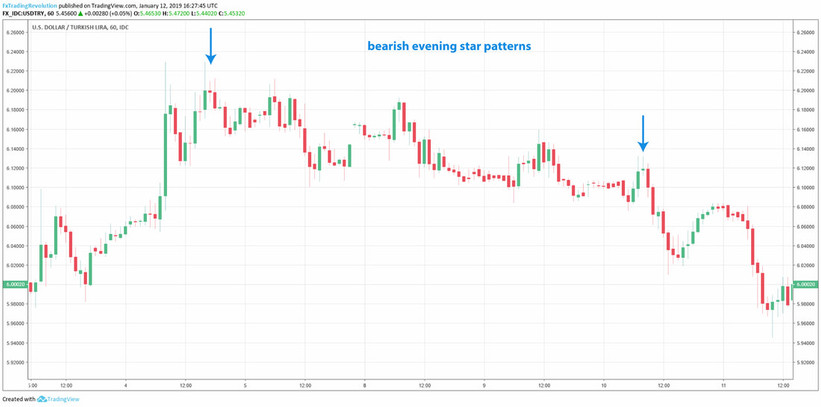
It is a pattern of three sticks: with a short body candle between a long red body followed by a long green body (bullish version) or vice versa in the bearish version (long green followed by a long red body). This pattern is also signaling a reversal.
In the chart below you can see the bearish version of Morning Star (known as the Evening Star).
4. Hanging Man
Another very interesting reversal pattern and one of my favorite.
In its continuation version, it indicates that there was a massive selling during the day, but that buyers managed to raise the price again - signaling a continuation of the current trend.
To put it simply, this pattern looks exactly the same like the Pin Bar (hammer), but the difference is that it appears during an uptrend instead of a downtrend.
The Hammer is a reversal pattern and the Hanging Man is a continuation pattern.
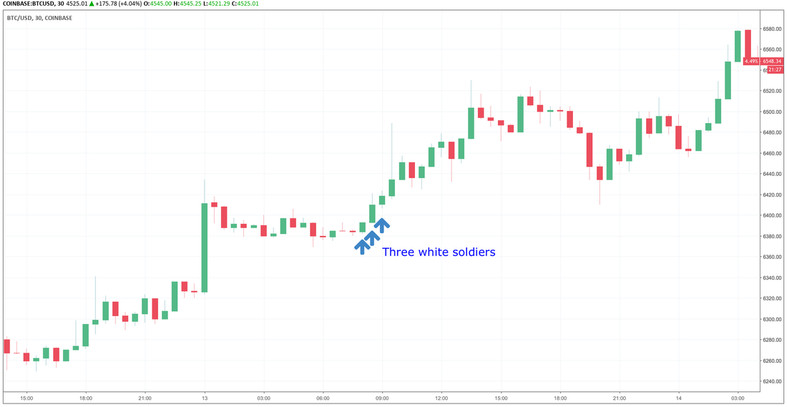
5. Three white soldiers
The pattern of the three white soldiers occurs with three candlesticks. It consists of long green (or white) consecutive candles with small wicks, which open and close progressively higher than the previous candle.
This indicates a powerful bullish signal that occurs after a low character trend and shows a constant advance of the buying pressure. It also points out there is low selling pressure and that there is a bull market on the horizon.
There are many more highly profitable and effective candlestick patterns. I would personally recommend learning all of them as I personally used most of them in my profitable trading. Below you can see the most popular ones.
