
I’ll be the first to admit that I’m a big fan of price action analysis, just using patterns and support / resistance or trendlines to measure the market and trade based on these simple signals.
Many experienced traders also tend to trade in this way as it helps them in understanding the market better.
However, despite some of the negative hype, indicators are also great tools for anyone, myself included!
They can significantly help to simplify your trading when it comes to translating all the information on the graphs. They can, for example, help you when you don’t have enough time to sit down and analyze all the charts, providing you with instant information that you would’ve spent much more time gathering.
So, for you, I’m presenting you the best indicators for trading Bitcoin and other Cryptos. Keep in mind, I like to keep it simple, so that may reflect in the list.
The Best Crypto & Bitcoin Indicators: Choosing Your Friends In Battle
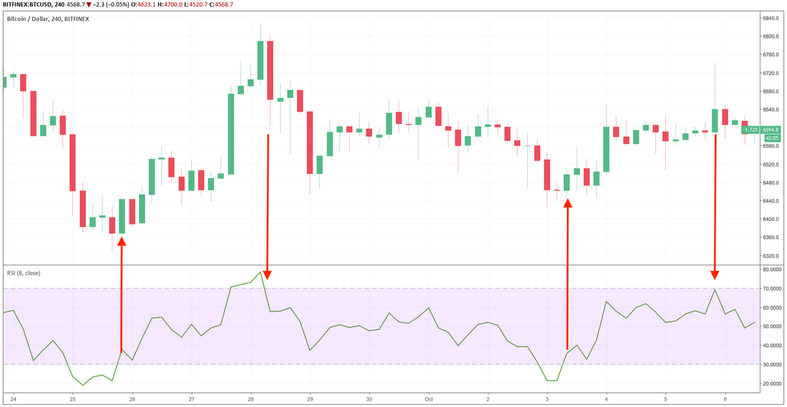
1. Relative Strength Index (RSI)
The first one on the list also happens to be my favorite, and it’s actually the one I use the most for providing quick signals for possible entry points - the RSI.
This indicator works by measuring the overall strength of a trend, and it’s divided among levels. Usually, the most important levels on the RSI are considered to be 30 and 70.
When the RSI touches 30, it means that the market is oversold; it has probably reached its minimum price and a reversal is very likely. This usually means going long when the bullish signal is confirmed (when RSI moves back above 30 level).
When the RSI touches 70, the opposite happens; the market is overbought and the price will likely soon enter a downtrend. A sell signal is generated and confirmed when the RSI moves back below the 70 level.
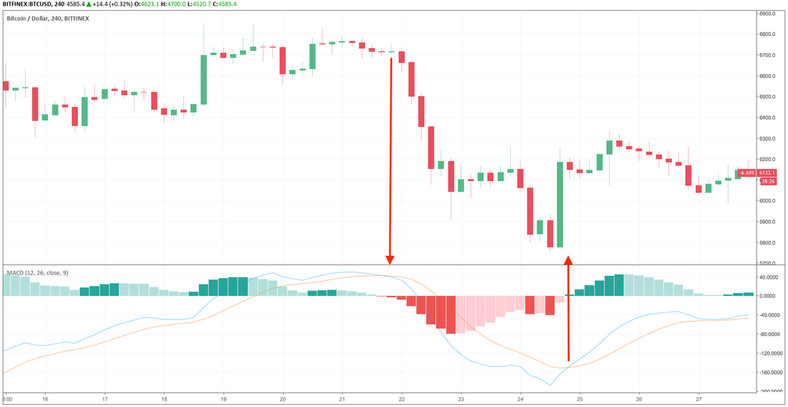
2. Moving Average Convergence/Divergence (MACD)
The MACD is another indicator that works wonders by itself, it’s a separate moving average that’s drawn over a momentum measure in bars.
The average itself is a calculation of recent movements and one of the overall price action. When these lines are parallel, it means that the trend is strong, which changes when the lines start to converge.
Therefore, when the lines cross, it indicates the potential start of a trend, which should be confirmed by the momentum bars of the indicator.
However, make sure to test this indicator properly before using it in your strategy (as the crosses can be a little bit delayed if the upcoming trend isn't going to very strong). This can be solved by setting lower periods in the settings of the indicator, but, the disadvantage is that lower periods tend to show more false signals.
The key to using this indicator is to find the right balance in its settings in relation to how the market usually moves. Also, the MACD, as well as most of the other indicators can be used both for entering and for exiting trades.
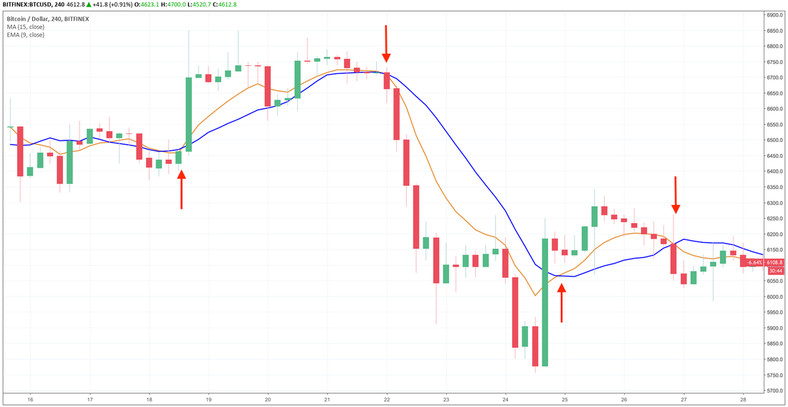
3. Simple Moving Average (SMA) and Exponential Moving Average (EMA)
I placed these two together because I always use them in this way. A moving average is an indicator that grabs the average price traded for a given market (for example Bitcoin) and draws it as a line over the candles on a chart. They are used to help with visualizing trends more easily and to estimate reversals.
The difference is in the formula for each type of moving average and in the form in which prices are calculated with this indicator.
SMAs are calculated by grabbing a long series of data points in time (depending on the settings) and simply averaging the price of each one. On the other hand, EMAs are drawn with the most recent prices taking a more important part in the calculation (the formula is slightly more complex).
If you use both, they work similarly to the MACD, with the EMA confirming trend changes by converging with the SMA.
Also, in general, moving averages tend to work better in long and stable trends with clear trend changes. On the other side, moving averages usually provide false signals in sideways markets.
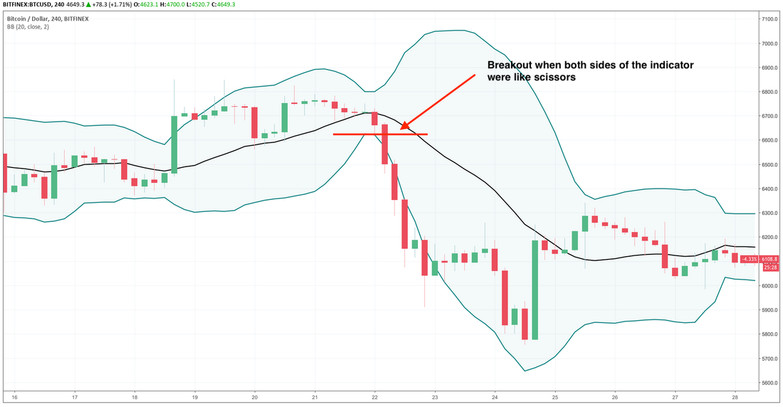
4. Bollinger Bands
Bollinger bands are fairly straightforward. They’re composed by a moving average in the middle and two parallel lines above and below it that also average the highest and lowest prices. The great thing about this indicator is that it gives you likely support and resistance levels which could be used as T/P and S/L points.
Also, when both sides of the indicator start moving against each other (like scissors), it indicates that a breakout will most probably happen soon.