Probability is nothing more than the likelihood for an event to happen. We use probability to know how close to being certain we can be regarding an outcome.
When it comes to trading, high probability trading is a way to call the act of opening and closing positions where the chance of profit is very high.
Even though you can never be 100% sure that something is going to happen when it comes to trading, there are methods you can use to ensure that your trades have the higher chance of being profitable.
1. Measuring Momentum Through Price Action
Knowing when a trend is dying out or bursting is very important when it comes to placing a trade. The momentum of the trend is your first signal regarding which position you should open.
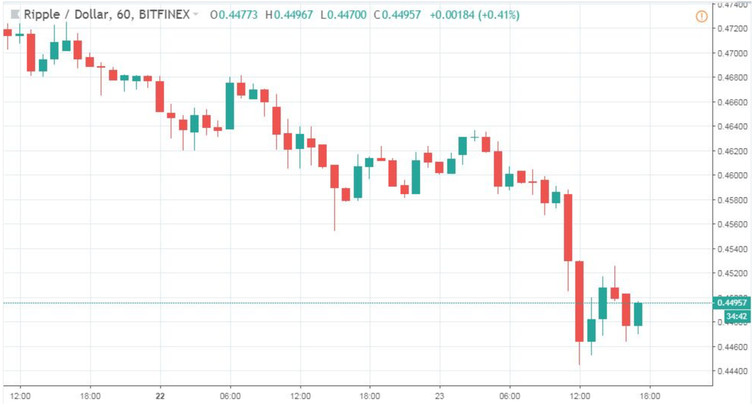
Looking at the previous chart, you can easily see that the downwards momentum was never lost. While the candles may get smaller and some green ones appeared, there was never a progressive reduction of momentum before the micro-reversals (just a couple).
When the contrary movements are not significantly larger than the trend average, then you know that following it is a high probability trade.
2. Recognising Support and Resistance Levels
Once you spot a dying or bursting trend, the next step is to know when to open a counter position or the position in the direction of the main strong trend. This always depends on the situation. That’s where support and resistances come in.
Look:
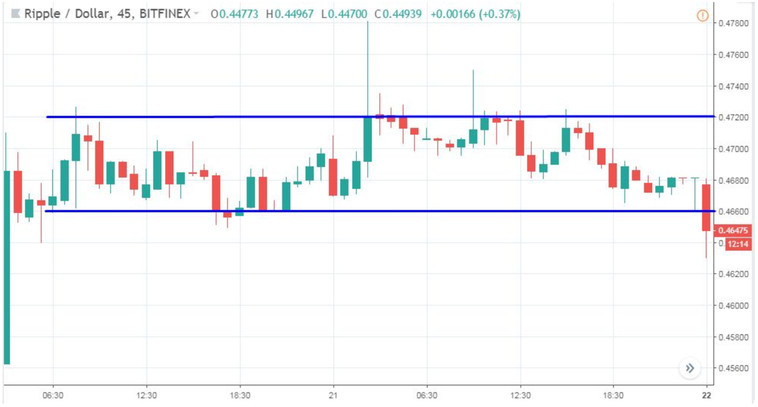
You can see how every time the market neared a support or resistance level, it was more likely that the price would reverse. Spotting these is a great way to know when to open positions.
3. Knowing The Chart Patterns
Recognising chart patterns that offer a high probability of continuation is another excellent way to increase the likelihood of profitable trades.
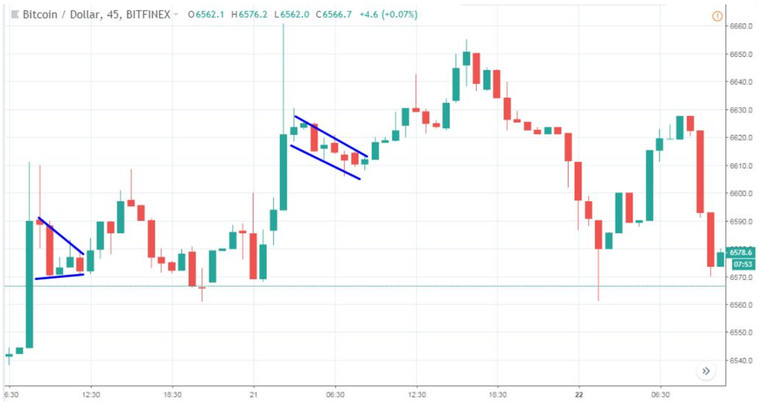
Here, we have a flag and a pennant. These patterns are recognisable due to a brief reversal after a huge trend, just to later continue in the trend direction. Opening trades when the reversals start losing momentum and in the direction of the main strong trend is a highly safe trade.
4. Using Inside Bars
Inside bars are candles that form within the limits of a previous movement (candle). They’re a great in-chart indicator that offers solid spots to open trades and place your take-profit and stop-loss orders.
When Inside Bars appear in the chart, it's the best to wait on their breakout and trade them only in the direction of the breakout. The breakout confirms the validity of the pattern. Inside Bars can also give signals both against the trend or in the direction of the main trend.
I personally like to trade them as a trend following strategy - so entering in the direction of the overall trend. But the truth is, counter-trend Inside Bars can be very profitable as well (for example if you trade them on H1 time-frame and the breakout appears against the H1 trend, but in the direction of D1 or W1 time frames - this means that you still trade in the direction of the long-term trend).
5. RSI and Bollinger Bands
Finally, coupling Bollinger Bands and a Relative Strength Index indicator is an amazing way to ensure that you see the movements coming before they occur.
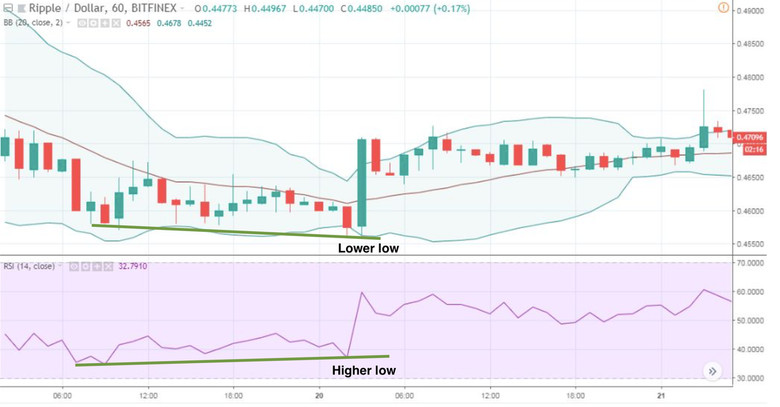
Oftentimes, like on the previous graph, a convergence between Bollinger Bands and the RSI means that the market will adjust soon.
And, as you can see there, the market was moving slightly against what the RSI showed, so it eventually corrected and followed suit (when compared the swings, before the big bullish candle, RSI made higher low, while the market made lower low - this is also called a divergence between the market and the indicator).
Comparing Bollinger Bands with RSI and following these indicators goes a long way into making your positive outcome probability as high as it can be!
Filtering out fake signals and trading only the high probability signals is the basic key to long-term successful trading any market. Each of the strategies that we have published here on the Fx Trading Revolution website follows this simple rule.
Trade well!
