

While I’m not much of a long-term trader myself, I can certainly recognize the attraction towards this approach.
The big, big numbers to be made are really alluring, and it’s nice to be able to simply place your order and then not worry about it in months or even years!
So, knowing how an important portion of the community is invested in long-term trading, let’s talk about how to take advantage of the weekly chart for BTC.
1. Long-Term Trading: The Fundamentals
Long-term trading tends to abandon technical analysis in favor of a fundamental approach. As such, studying past movements and using indicators is less prominent than paying attention to the news and ambiance of the market.
Nevertheless, this should not be mistaken for a complete abandonment of the technical study of the ecosystem, which is a mistake that many traders do.
The natural approach should be (and it tends to be highly profitable) to develop your hypothesis based on the fundamental forecasts and then wait for your charts and indicators to confirm it.
2. Why The Weekly Chart?
Since you do need to keep an eye on the graphical factor in the equation, you need a chart time frame that lets you have the most precise look you can have.
Look at this monthly chart of BTC:
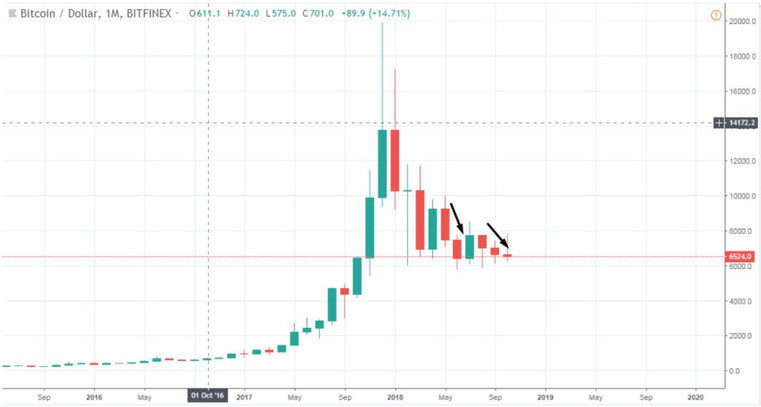
Let’s say you wanted to enter the market as soon as it started; how would you know when to enter, from a technical point of view?
Aside from that, how many opportunities would you have, let’s say, in from May to October? Two “trends”.
Now, how about this weekly chart?
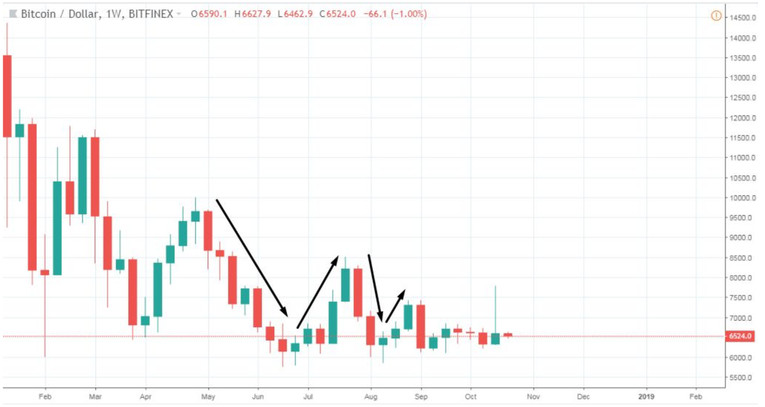
Four different swings, two of which are brief trends (or three, depending on how you look at it). And I didn’t even show the strong bullish trend of BTC!
Using the weekly chart gives you more relevant information about the market to work with, as easy as that.
3. How To Actually Trade With The Long-Term Mindset
As said, you can trade on the news, but it’s usually better if you have technical analysis confirming this. With that being said, I’ll show you my two favorite indicators for trading the weekly charts:
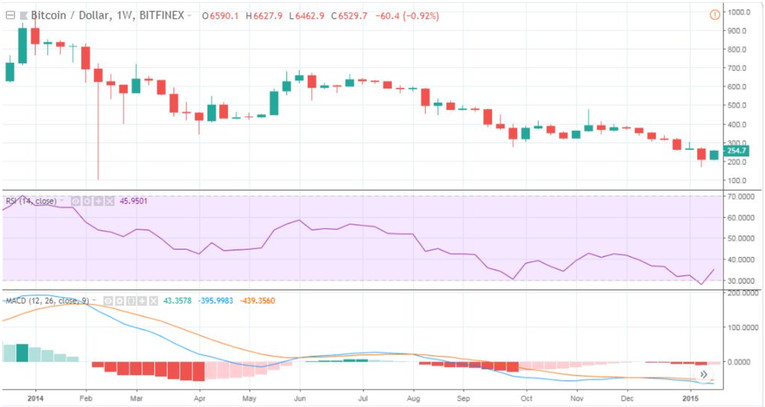
The RSI and the MACD.
Why?
Easy, the RSI and the MACD complement each other perfectly in predicting trend reversals. You can gauge the legitimacy of the MACD crossovers with the RSI oversold and overbought signals.
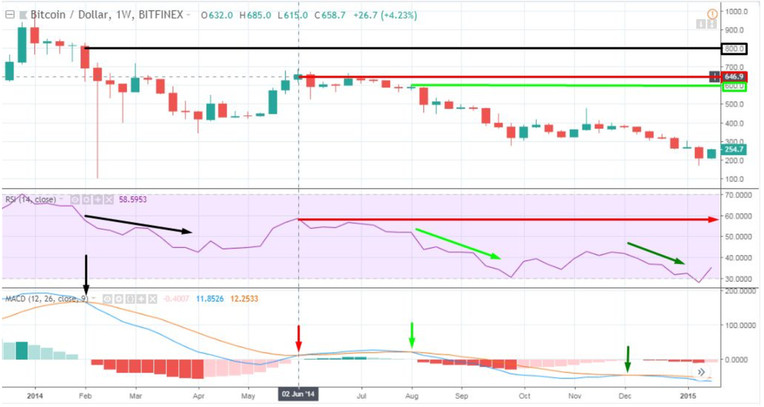
Here, you can easily see why I use these two together. I’ve separated three instances: one black, one red, and one green.
Long-term time frames like weekly or monthly definitely have an important role in each trading strategy. You can trade and invest based on them, or you can only analyze them and then open trades based on lower time-frames.
Thanks to that you will always trade in the direction of the overall trend while also timing your entries for better trades. This is called multi-time-frame analysis and is one of my best trading techniques as well.