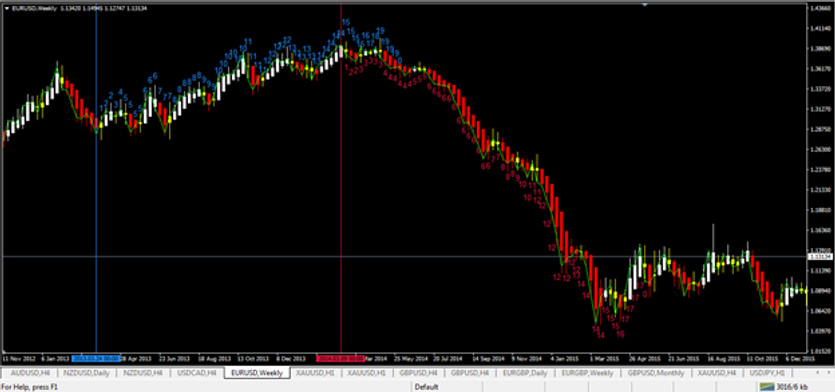
The Heiken Ashi Doji Spotter was built off the traditional Heiken Ashi Indicator that comes shipped with the Metatrader trading terminal. Its primary focus is to identify the correction phase of trends in any asset class by following a wave count algorithm.
Below, is a description of how the wave count algorithm for the Heiken Ashi Doji Spotter works.
Description
The above daily chart of the EURUSD shows the Heiken Ashi Doji Spotter indicator on the main chart, and the equivalent wave count algorithm on the sub window. Notice how the bearish trend is clearly identified on the sub window which we’ll look into the algorithm below.
The Heiken Ashi candlestick easily identifies consecutive bullish or bearish closing candlesticks on a time frame and the immediate time frame above it.
Before we go into how the Heiken Ashi Doji Spotter works, lets first highlight the three main features of the indicator.
The Bullish candlesticks are colored Blue, while the bearish candlesticks are colored red. The Doji, which is the indecision candlestick here, is colored yellow.
The Count Algorithm for Spotting Trends
Bearish Wave Count
Zero Wave Count Condition in a bearish Trend
The bearish wave count sequence starts from zero by first spotting the nearest three consecutive bullish closing candlestick.
First (1) Wave Count in a bearish Trend
Where the last count was zero, if the next candlestick closes as a Doji (Yellow) or bearish (red), the count increases to one (1), on the other hand, if the candlestick stays bullish, the count remains at zero for a bearish trend count.
Second (2) Wave Count in a bearish Trend
The count would increase from one to two if the candlestick closes bearish (red), and remain at one if the candlestick is either Doji (Yellow) or bullish (Blue). The bearish wave count is reset to zero if we encounter three consecutive bullish candlesticks in a row.
Third (3) Wave Count in a bearish Trend
Where the last count was 2, the new count would increase to three, if the last candlestick closed as a Doji Yellow or bullish Blue.
Note:
The count continues as long as three consecutive bullish candlesticks are not signaled.
The opposite applies to a bullish wave count.
Bearish - Entry and Exit Conditions (Stop Loss, Take Profit)

1-2-2-3-3-3-3-3-4-4-4-4-4-4-5-5-5-6-6-6-6-6-6-6-6-6-6-6-6-6-7-7-8-8-8-9-10-10-11-11-12-12-12-12-12-12-12-12-12-12-12-12-13-14-14-14-14-15-15-15-16-17-17-17-17-0
Using the above image as reference and considering the bearish trend count.
Entry Level:
Sell trades are signaled when a wave count is an odd number (3, 5, 7, 9, 11, etc.). However, high probability trade setups should be taken starting from the wave count 5.
Exit in Loss
Losing trades can be exited in a bearish wave count in three different ways, depending on which one comes first.
The first scenario is by setting a fixed price target known as the Stop Loss level.
The second scenario is via a price close above a significant resistance level. For a bearish wave count, it will be the highest high after the first bearish count.
The third scenario is after three bullish closing candlesticks confirming an end of the bearish trend.
Let’s take a look at them.
Exit by Stop Loss:
The stop loss for the bearish trend on the chart above varies depending on the Odd number wave count that triggered the loss.
For every odd number wave count on the above chart, the stop loss should be set by considering the high-low range of the odd counts, which could vary.
So, if the high low range is 50 pips, the stop loss should be set at 1.5X (75pips), where X is 50.
Exit by Price Close above Significant resistance
A sell trade can again be exited in a loss if the current time frame price close above the highest high while the Doji (Yellow) or odd wave count resistance is established.
Exit by Take Profit
Following a bearish trend, we can exit in profit as soon as we attain a risk to reward ratio of 1:1, 1:1.5, or 1:2.0.
We can also lock in about 80% of our open sell trade in profit after two consecutive bearish closing candlesticks and trail the rest, followed by setting the stop loss to a break-even point.
Bullish - Entry and Exit Conditions (Stop Loss, Take Profit)

1-2-2-3-4-5-5-5-5-6-6-6-7-7-7-8-8-8-8-8-8-9-9-9-10-10-10-10-10-10-11-11-11-11-12-12-12-12-12-13-13-13-13-13-13-14-14-14-14-14-15-15-15-15-15-16-17-18-19-19-19-19-0
Entry Level:
Buy trades are signaled when a wave count is an odd number (3, 5, 7, 9, 11, etc.). Like the bearish wave count, high probability trade setups should be taken starting from the wave count 5.
Exit in Loss
For a bullish wave count, losing trades can be exited in three different ways, depending on which one comes first, just like the bearish wave count.
The first scenario is by setting a fixed price target known as the Stop Loss level.
The second scenario is via a price close below a significant support level. For a bullish wave count, it will be the lowest low after the first bullish count.
The third scenario is after three bearish closing candlesticks confirming an end to the bullish trend.
Let’s take a look at them.
Exit by Stop Loss:
The stop loss for the bullish trend on the chart above varies depending on the Odd number wave count that triggered the loss, just like the bearish wave count.
For every odd number wave count on the above chart, the stop loss should be set by considering the high-low range of the odd number counts, which could vary. So, if the high low range is 50 pips, the stop loss should be set at 1.5X (75pips), where X is 50.
Exit by Price Close below Significant support
A buy trade can also be exited in a loss if the current time frame price close below the lowest low while the Doji (Yellow) or odd wave count support is established.
Exit by Take Profit
Following a bullish trend, we can take profit as soon as we attain a risk to reward ratio of 1:1, 1:1.5, or 1:2.0.
We can also lock in about 80% of our open buy trade in profit after two consecutive bullish closing candlesticks and trail the rest, followed by setting the stop loss to the trade entry price.
Conclusion
The Heiken Ashi Doji Spotter indicator is excellent for spotting and scaling into an established bearish or bullish trend. It is worth mentioning that a trend on say a 4hour time frame is a consecutive bullish or bearish closing Heiken Ashi closing candlesticks on the daily time frame.


